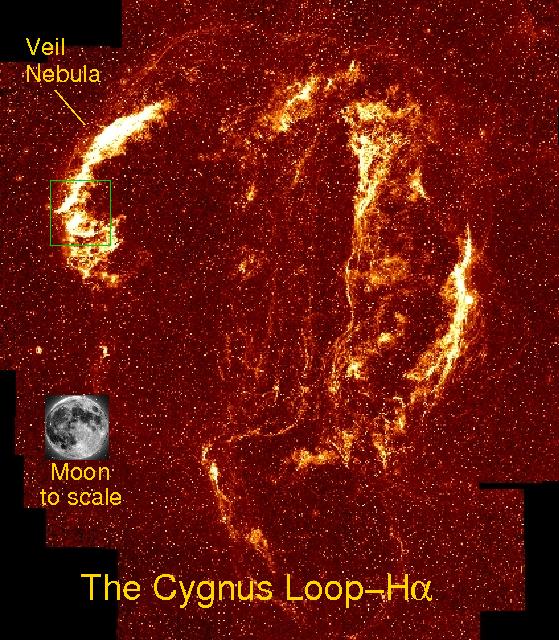
 An image of the entire Cygnus Loop in the
light of hydrogen-alpha, 656.3 nm. (Data courtesy of Nancy Levenson.)
An image of the moon is superposed to scale, and the region enlarged below
is indicated with a green box.
An image of the entire Cygnus Loop in the
light of hydrogen-alpha, 656.3 nm. (Data courtesy of Nancy Levenson.)
An image of the moon is superposed to scale, and the region enlarged below
is indicated with a green box.
The information provided on this page is EMBARGOED for release 11:20 a.m. MDT on June 3, 2004, at the 204th American Astronomical Society Meeting in Denver, CO. This page supports presentation 74.05 "FUSE Observations of a Star Behind the Cygnus Loop," by W.P. Blair, R. Sankrit, S. I. Torres, P. Chayer (all of Johns Hopkins University), C. W. Danforth (Univ. of Colorado Boulder), and J. C. Raymond (Smithsonian Astrophysical Observatory).
For a text description of this result, please CLICK HERE.
To link to the press release about this result, please CLICK HERE. (Also available in RTF format.)
Click on any image to see a larger version.
An image of the entire Cygnus Loop in the
light of hydrogen-alpha, 656.3 nm. (Data courtesy of Nancy Levenson.)
An image of the moon is superposed to scale, and the region enlarged below
is indicated with a green box.
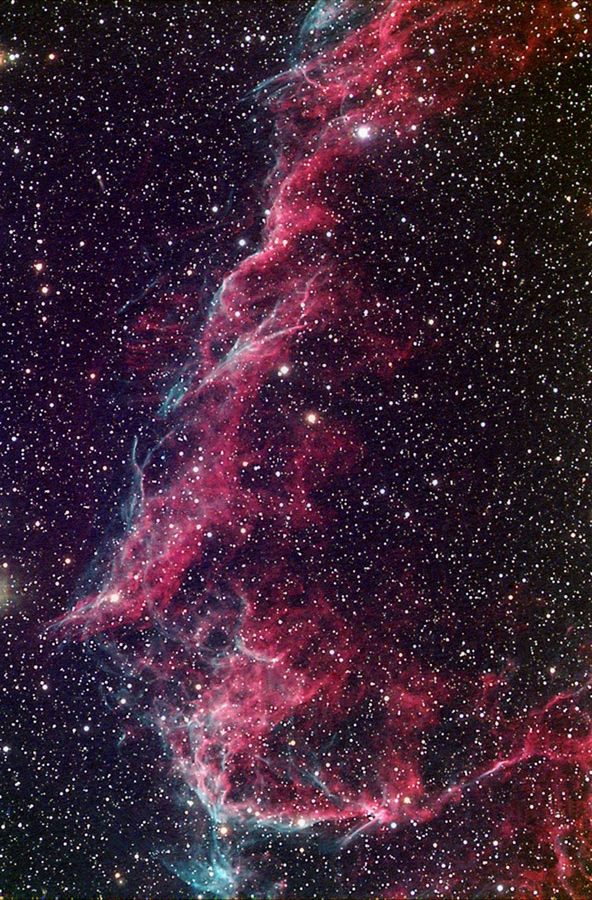 An optical color CCD image of the NE Cygnus Loop, also known as the Veil Nebula, by amateur astronomer Steve Mandel. (Used
with permission.*)
An optical color CCD image of the NE Cygnus Loop, also known as the Veil Nebula, by amateur astronomer Steve Mandel. (Used
with permission.*)
*See Steve's Web site for details.
 A summary figure comparing regions around
the background star in optical and UV light. An enlarged region shows
the positions of where FUSE observed adjacent to the star. The component
figures that went into making this figure are provided separately below.
A summary figure comparing regions around
the background star in optical and UV light. An enlarged region shows
the positions of where FUSE observed adjacent to the star. The component
figures that went into making this figure are provided separately below.
Also available in TIFF format.
 Black & White image comparison. Left, an
optical image of a portion of the Veil Nebula from the Digitized Sky Survey.
(Right) An ultraviolet image of the same region, taken with the Ultraviolet
Imaging Telescope.
Black & White image comparison. Left, an
optical image of a portion of the Veil Nebula from the Digitized Sky Survey.
(Right) An ultraviolet image of the same region, taken with the Ultraviolet
Imaging Telescope.
 A section of the optical figure from
above, scaled to the next figure (ultraviolet image). The star of
interest is near the top of the figure. (See summary figure above for
details.)
A section of the optical figure from
above, scaled to the next figure (ultraviolet image). The star of
interest is near the top of the figure. (See summary figure above for
details.)
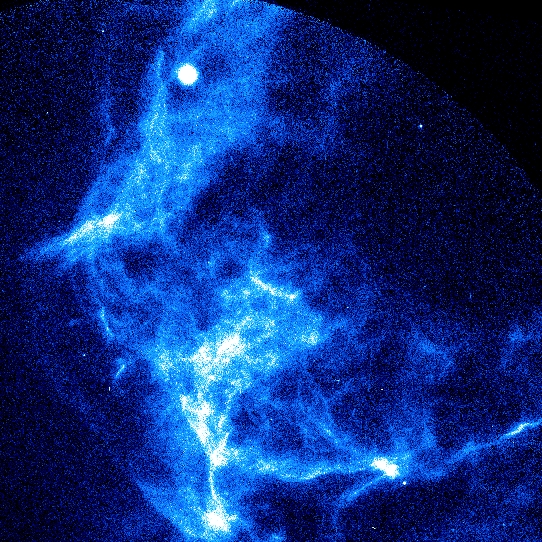 An ultraviolet light image of the same
region as the previous figure. The star of interest appears as a bright dot
toward the top of the frame. (See summary figure above for details.)
An ultraviolet light image of the same
region as the previous figure. The star of interest appears as a bright dot
toward the top of the frame. (See summary figure above for details.)
 A small region around the star (marked
with a green arrow). The diagonal yellow bars show the positions and
approximate sizes of the FUSE spectrograph apertures used for background
exposures. For clarity, the FUSE aperture "on" the star is not shown.
(See summary figure above for details.)
A small region around the star (marked
with a green arrow). The diagonal yellow bars show the positions and
approximate sizes of the FUSE spectrograph apertures used for background
exposures. For clarity, the FUSE aperture "on" the star is not shown.
(See summary figure above for details.)
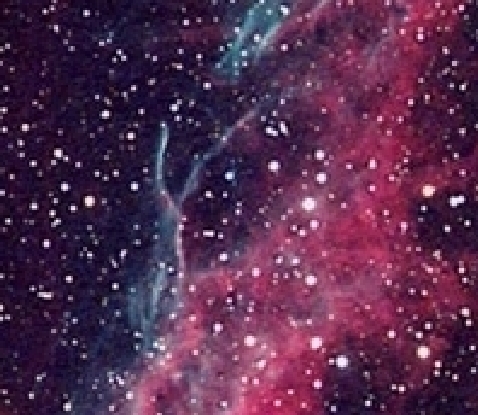 A smaller region of the optical data,
approximately centered on the star of interest. The next figure shows
the same region from the ultraviolet image.
A smaller region of the optical data,
approximately centered on the star of interest. The next figure shows
the same region from the ultraviolet image.
 A smaller region of the ultraviolet image,
scaled to match the previous figure.
A smaller region of the ultraviolet image,
scaled to match the previous figure.
 A graph showing a 12 Angstrom region
of the FUSE spectrum. The black histogram is the light from the star.
The narrow dips are due to absorption eithe by interstellar gas or
in the atmosphere of the star itself. The lines marked "ISM" are
several stronger lines from interstellar gas. The two features
marked "SNR" are from highly ionized oxygen. These lines come
from very hot gas within the supernova remnant. The presence of these
absorption lines indicates that the star must be behind the Cygnus Loop.
A graph showing a 12 Angstrom region
of the FUSE spectrum. The black histogram is the light from the star.
The narrow dips are due to absorption eithe by interstellar gas or
in the atmosphere of the star itself. The lines marked "ISM" are
several stronger lines from interstellar gas. The two features
marked "SNR" are from highly ionized oxygen. These lines come
from very hot gas within the supernova remnant. The presence of these
absorption lines indicates that the star must be behind the Cygnus Loop.
(Note: while this small figure "breaks up," clicking on the figure will
load a larger, readable version!)
PHOTO and FIGURE CREDITS: William P. Blair (Johns Hopkins University) except as noted above.
If you have questions or comments, please let me know.
Last updated: June 2004.
Bill Blair ([email protected])