The Electromagnetic Spectrum


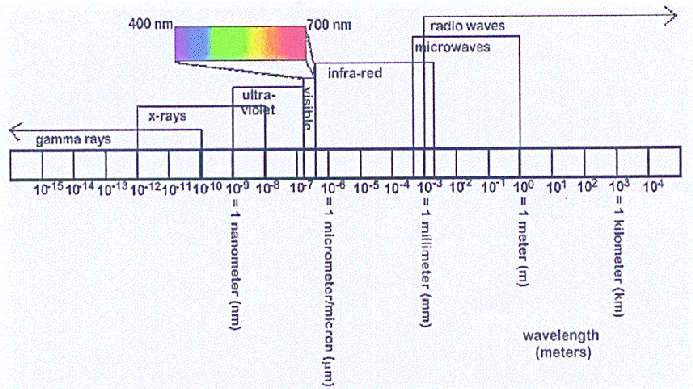
This diagram shows the entire range of light wavelengths attributed to the
electromagnetic spectrum. The scale bar is marked off in powers of ten, meaning that
for each step along the bar, the light wavelengths increase by 10 times! Notice that
the visible light region makes up a tiny portion of this overall spectrum of light.
(From William J. Kaufmann III, Universe, (4th Edition: 1994), W. H. Freeman
and Company, NY. Figure 5-6.)
Optical light is only a small part of the much
more expansive electromagnetic spectrum that includes everything from so-called gamma
rays at the shortest wavelengths to radio waves at the longest wavelengths. In fact,
the range of wavelengths for the various classifications of light is so great we
have to use powers of ten to describe it! The wavelengths of radio light are actually
macroscopic--typically anywhere from centimeters to 10's of meters in length.
Wavelengths of optical light are so small that several thousand of them could fit in one
millimeter! And gamma rays have wavelengths that are smaller still by a factor
of 10,000 or more!
The violet and red "ends" of the optical spectrum are not really "ends" at all, but
rather simply the limits to the portion of the EM spectrum to which our eyes are
sensitive. Beyond red light lies the region known as the infrared, which is also
simply known as heat radiation. (The fact that light is just energy may be most
obvious in this portion of the spectrum!) The longest wavelength infrared radiation
blends into the shortest wavelength radio waves, and the radio region extends out to
the longest wavelengths we are able to measure.
Likewise, beyond the violet of the optical spectrum lies a broad region known as the
ultraviolet, which blends into the X-ray region, followed by the the shortest wavelength
radiation known, the gamma rays. Again, there is no edge or "end" of the spectrum
at shortest wavelengths, although we reach a practical limit as to what can be
measured. (The shortest wavelength gamma rays are on a par with the size of an
atomic nucleus!)
There are no hard boundaries to each spectral region; they just blend together into
a continuum of smoothly changing wavelengths. Even the boundaries themselves are
ill-defined, which is why in the diagram above we show overlaps in some of the ranges.
The spectral regions are just convenient
definitions that are used for reference, and can be modified as needed. For example,
for some purposes it is convenient to define a range of wavelengths between infrared
and radio, which is called the microwave region. To make this region, scientists
simply revised the assumed boundaries for the infrared and radio regions and inserted
this newly defined region inbetween!
Scientists also find it convenient at times to refer to smaller "sub-regions" of these
major spectral regions. However, these sub-regions are not always well-defined,
and different conventions are sometimes followed. For instance, the infrared region
is sometimes broken into the "near-infrared" (closest to the red optical spectrum) and
the "far-infrared" (closest the the microwave or radio region). However, the ultraviolet
spectral band more often gets broken into three sections: the near-ultraviolet
(closest to violet optical light), the far-ultraviolet, and finally the
extreme-ultraviolet (closest to the X-ray region).
Then in the X-ray region, an entirely different convention is used. In this region
we refer to "soft X-rays" as those closest to the ultraviolet region, and "hard
X-rays" as those closest to gamma rays! (Go figure.) Thus, an X-ray astronomer
might say one spectrum is "harder" than another, meaning it has more short wavelength
(high energy!) emission than a comparison spectrum.
Related link: You may want to visit this nice site at NASA/Goddard
Space Flight Center that describes more details about the EM spectrum.
Click here to go to next section.
Return to Spectroscopy Home Page.
Bill Blair ([email protected])

